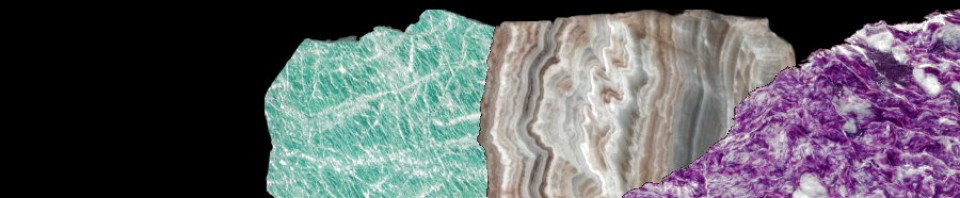
INFRARED REFLECTION SPECTROMETRY OF MINERALS AND GEMS
MIKHAIL OSTROOUMOV, BERNARD LASNIER, SERGE LEFRANT
CATALOGUE OF THE SPECTRUM. NANTES 1993-2009

[spoiler intro="Introduction"]The purpose of this paper is to show the benefits and applications of using mid and far infrared reflection spectroscopy (IRS) in the analysis of minerals, gemstones and archaeological materials.
IRS is a non-destructive technique that can provide diagnostic and crystal chemical information on the mineralogical phases of stone artifacts, artworks, and buildings materials. Since non-destructive methods are preferred in mineralogical, gemological and archaeometric identification, the IRS method is considered to be an appropriate method for this aim.
The characteristic of each spectrum is determined by vibrations of the atomic groups of the crystalline structure of minerals. All the infrared spectra characteristics of minerals are related with their crystal chemical parameters (Farmer, 1974). First of all, we would like to show the practical use of the infrared reflection spectroscopy that is very important tool for mineralogists and gemologists.
The current study was undertaken to compensate for the absence of published literature relating to the IRS of minerals, gemstones and stone artifacts. Existing infrared spectral databases for minerals are comprised of data collected from powdered samples.
IRS presents many comparative advantages in comparison to infrared absorption spectrometry of minerals and thus there is a need for a new reference database of infrared reflection spectra of minerals, gemstones and stone materials.
An IRS database such as referenced here will facilitate spectral searching and characterization of minerals and stone materials found in geological, gemological and archaeological contexts.[/spoiler]
[spoiler intro="Analytical results"]Spectral features of minerals in the infrared range are the result of vibrational and rotational processes that provoke the characteristic bands. Their number, intensity, and shape are dependent on atomic masses, interatomic force fields, and, particularly, molecular geometry. The infrared range is subdivided into three ranges:
near infrared (PIR: 13333-4000 cm -1 or 0.8-2.5 µm);
mid infrared (IRM: 4000-400 cm -1 or 2.5-25 µm);
far infrared (IRL: 400-10 cm -1 or 25-1000 µm).
The near infrared range is favorable for the identification of the typical bands of some chemical groups or ions such as Fe 2+ (0.8-1 mm), H2O (1.4;1.9 mm), OH (2.2; 2.7 mm), and CO3 (1.9; 2.0; 2. 17; 2.3 mm).
Thus these absorption bands are used for the qualitative or semi quantitative analysis of these groups and can be used to determine various elements.
In the mid infrared range, the reflection or absorption bands are normally visible due to the presence of various minerals’ atomic groups.
The mid infrared spectra of the mineral offer significant information about the functional groups of which it is constituted.
The majority of the mineral’s characteristic bands meet in the mid region of the infrared spectrum.
The far infrared range is a range where the fundamental bands of basic frequencies of various atomic groups are observed. To date, this range has not been studied in depth for mineral compounds.[/spoiler]
[spoiler intro="Experimental methods"]The observation of minerals by infrared spectrometry can be done into two general ways: by absorption or reflection.
The mineral frequency vibrations are generally measured by infrared absorption spectrometry. But the absorption spectrometry has a series of limitations: firstly, it is a destructive method. During the preperation, it sometimes influences on the crystal structure of the minerals and its elemental cell parameters (e.g. opal, phyllosilicates).
The spectrum obtained from powder is an average spectrum and one loses part of diagnostic information on the structure of anisotropic minerals.
This method does not guarantee the cleanliness of the preparation, which is why in the spectrum one can observe false bands.
The minerals often have very broad absorption bands. There are also many problems with the dimension of crystals; the degree of pulverization, the quantity of minerals and the presence of inert compound (the potassium bromide used for the preparation of samples).
In general, the preparation of samples for the absorption spectrometry requires very much time, expenses and materials. Thus, we prefer the reflection infrared spectrometry. Currently the infrared measurements of the reflection spectra of minerals are likely to extend since the appearance of stable and practical spectrometers with the complementary reflexction equipment.
The advantages of the infrared reflection spectrometry are numerous. It is a non-destructive investigation method that can be applied:
For minerals with natural surface (the crystallographic faces, planes of cleavage, non uniform surfaces),
For cut and mounted gems, it can constitute a test of identification for these stones.
The usable surface of samples can be variable, from a few cm2 to a few mm2. The acquisition of a spectrum is a one-minute command. This method is much easier to implement than the absorption spectrometry. The reflection spectra show many narrow bands; sometimes the number of the reflexion bands is more significant than the number of the absorption bands. Thus, the infrared reflection spectra always bring more information on the functional groups that constitute them. The reflection and absorption bands seldom coincide. The law Kramers-Kroning has explained the displacement of the absorption maximum.
In general, this displacement depends of the position and configuration of the reflexion band. For example, carbonates, the maximum intense reflection (nearly 1400 cm-1) are placed in a more shorter wavelengths, but the weak maximum nearly 800 cm-1 is placed in more longer wavelengths.
By this, the direction of displacement depends of the intensity absorption:
For the intense vibrations : l abs > l ref.,
For the weak vibrations: l abs < l ref.
Mid infrared reflection spectra relate directly with the crystal chemistry of the mineral matter, that is to say, with their physical constant.p>
For that reason, this spectrum has the characteristics that allow identifying the mineral species. To determine the natural or synthetic origin of gem materials, it is necessary to analyze them in the near and far infrared ranges, even in the visible region. Each mineral, natural or synthetic gem presents a quite particular infrared reflexion spectrum, which allows a fast identification of the mineral species. For the exact identification, it is necessary to take into account the effect of the orientation of mineral crystals and rough stones.
For most of these minerals, the orientation modifies the relative intensities of the bands of the spectrum. But the general character of the spectrum does not change, that is to say, that this parameter does not intervene in the identification.
Sometimes one observes the displacement of some bands according to the orientation of the crystals. The displacement of the characteristic bands is typical for the solid solutions (isomorphous series). Therefore, we have the spectra that were registered for the crystals with a well-known orientation.[/spoiler]
[spoiler intro="Sampling"]The creation of an infrared reflection spectra catalog it necessitates the need for obtaining spectra on samples with the greatest possible of purity.
Keeping in mind these imperatives, we have selected nearly 200 mineral species of enough dimensions to be guided, carved and refined.
These samples of the greatest purity were identified by the traditional gemological and mineralogical methods.
Each ” standard ” sample has been analyzed quantitatively with the electron probe microanalyser CAMECA SX 51 at the Saint Petersburg Geological Institute (Russia).
The results of these analysis have been deposited at the Mineralogical Department (University of Michoacan, Mexico) and at the Mineralogical and Gemological Laboratory (University of Nantes, France).
These ” standards ” will also be in the disposition of the researchers who could request them to compare their own mineralogical and gemological samples.[/spoiler]
[spoiler intro="Obtaining the spectra"]The infrared reflection spectra were obtained with the specific equipment that we have in our disposition for the spectrometric groups installed at:
1. Mineralogical Laboratory of the Saint Petersburg Mining Institute (Russia).
2. Mineralogical and Gemological Laboratory of the Mainz University (Germany)
3. Crystal Physics Laboratory of the Institute of Materials, of the Nantes University (France).[/spoiler]
[spoiler intro="Instruments used"]We have used various spectrometric apparatuses:
- Spectrometer IRS-29 (Russia)
- Spectrometer UR-20 (Germany)
- Spectrometer Perkin-Elmer FTIR (Germany)
- Spectrometer Bruker IFS-28 (France) – Spectrometer Nicolet 20SXC-FTIR (France)
We had the possibility of using these various apparatus to compare our results and to benefit from their complementarities.
The mineralogical and gemological samples have been guided and mounted on the universal accessory of reflexion with retro-mirror (Harrick Scientific Corporation).
The samples needed one, two or three different orientations according to their crystal system.
The calibration of the spectrometer has been systematically verified at the beginning of each register by putting on the apparatus a pure natural quartz crystal (the deposit Cholodnya, Ural Polar, KOMI Republic, Russia) according to two orientations: parallel and perpendicular to the axis of order 3.
The same spectra were obtained for the verification in various laboratories and with different spectrometric equipment.
The spectra have been recorded on diskettes and are available at the Mineralogical Laboratory (University of Michoacan, Mexico) and at the Mineralogical and Gemological Laboratory (University of Nantes, France).
In the above-mentioned it will be proposed the program of the automatic identification that this based on this spectrometry database on the medium infrared region of reflection.[/spoiler]
[spoiler intro="Model of card of the catalog"] As for the other catalogs of the infrared spectra already published we have proposed a double-sided card wich contains the following information:
Front side: information on materials taken as standard (natural, source, etc.) and experimental conditions
Back side: the spectrum records has a scale standardized allowing an immediate easy comparison for the spectrum registered under the similar conditions.[/spoiler]
[spoiler intro="Infrared reflexion spectra of minerals of various cristallochemical classes"] This work is the first systematic intent of the reflexion infrared catalog of minerals and gems. Approximately 220 species minerals, natural and artificial gems have been investigated in this work.
We have used at least the same presentation of the spectrometric data that of the Raman catalog (Pinet et al., 1992). We also propose two modes of presentation: one by mineralogical group and the other by alphabetical order.
We initially give a general spectrometric characteristics of the crystallochemical classes. Then, the catalog itself is presented in the form of cards classified by mineralogical groups.
These cards contain: the apparatus and the experimental conditions, the orientation of the sample taken as a standard, the obtained spectra and the position of the principal lines in cm-1 .
The scale of intensity have been eliminated since it depends on the operative conditions. The relative intensities of the peaks are without doubt more important. [/spoiler]
[spoiler intro="Conclusion"]The infrared reflexion spectrometry in the far region supplements a well spectrometry in the mid infrared zone for the various crystallochemical classes of minerals.
With Raman spectrometry, this non-destructive method makes it possible to determine the mineral species and varieties.
In our opinion, the infrared reflexion spectrometry in the different regions will be able to contribute to the resolution of the current problems of mineralogy, such as for example, the determination of close minerals by the chemical composition, the characteristics of zonation, optical orientation, inclusions and pleochroism, etc (Ostroumov, 1991; Ostroumov et al., 2000).
On one hand, this technique can lead to non-destructive identification of the gems and the art objects, with separation between the natural and synthetic crystals, with the identification of the treatment and the impregnation of the various substances of gemological materials, etc.
Using this method one can identify remotely, near or far, the rough surface or cut minerals, of gems and rocks in cosmic geology, astronomy, planetology, volcanology.[/spoiler]
[spoiler intro="References"]
Beny C., Lasnier B. (2001). Catalogue des spectres Raman des mineraux. Edition BRGM, France.
Farmer V.C. (1974). The infared spectra of minerals. Mineralogical Society. London.
Lazarev A.N. (1966). Vibrational spectra and structure of silicates. Edition Science. Moscow.
Maestrati R. (1989). Contribution a l’edification du catalogue Raman des gemmes. Diplome d’Universite de Gemmologie. Universite de Nantes.
Marfunin A.S. (1974). Introduction a la physique des mineraux. Edition Nedra, Moscou.
Marfunin A.S. (1975). Spectroscopie, luminescence et centres radiogeniques dans les mineraux. Edition Nedra, Moscou.
Niquist R.P., and R.O. Kagel (1971). Infared spectra of inorganic compounds (3800-45 cm-1). Academic Press, New York.
Ostrooumov M. (1991). Methode de determination du degre dordre-desordre dans la structure cristalline des feldspaths alcalins par leur spectres infarouges de reflexion. Memoires de la Societe Mineralogique de l’URSS, vol. 120, No.5, 94-99.
Ostrooumov M., Lasnier B., Lefrant S. (1995). Infrared reflection spectrometry of gem materials. Analusis 23, 39-45.
Pinet M., Smith D., et Lasnier B. (1992). Utilite de la microsonde Raman pour l’identification non destructive des gemmes. Revue de Gemmologie A.F.G. No. hors serie.
Plyusnina I.I. (1977). Spectres infrarouges des mineraux. Edition Universite de Moscou.
Povarennykh A.S. (1978). The use of infared spectra for the determination of minerals. American Mineralogist, vol. 63, 956-959.[/spoiler]
[spoiler intro="Listes des spectres infrarouges de reflection par famille mineralogique"]
| COMPOSITIONS SYNTHETIQUES 1. Opal 2. Emeraude Hydrothermal 3. Emeraude Chatham 4. Emeraude Lechleitner 5. Emeraude Gilson 6. Alexandrite 7. Spinelle rouge 8. Spinelle bleu 9. Spinelle incolor 10. Fianite 11. Fabulite 12. Corindon + V 13. Corindon + Cr 14. Corindon + Ti 15. Corindon incolor 16. Y.A.G 17. G.G.G 18. Quartz 19. Turquoise 20. Nd-verre 21. Verre Bleu 22. Verre jaune |
I. ELEMENTS NATIFS.1. Diamant 2. Soufre |
II. SULFURES 1. Sphalerite |
III. HALOGENURES 1. Fluorite |
||
|
IV. COMPOSITIONS DE OXYGENE |
|||||
| IV.1. OXYDES 1. Rubi 2. Saphire 3. Chrysoberyl 4. Alexandrite 5. Cristal de roche 6. Amethyste 7. Citrine 8. Quartz rose 9. Chrysoprase 10. Chalcedony 11. Perelivte 12. Spinelle 13. Rutile 14. Cassiterite 15. Hematite 16. Opal |
IV.2. SELS OXYGENES. |
||||
| IV.2.1. CARBONATES 1. Calcite 2. Rhodochrosite 3. Aragonite 4. Cerusite 5. Dolomite 6. Magnesite 7. Siderite 8. Malachite 9. AzuriteIV.2.2. BORATES 1. Colemanite 2. Rhodisite |
IV.2.3. SULFATES 1. Gypse 2. Anhydrite 3. Aryte 4. Celestine 5. AluniteIV.2.4. CHROMATES 1. CrocoiseIV.2.5. MOLYBDATES 1. Wulfenite |
IV.2.6. PHOSPHATES ET VANADATES 1. Apatite 2. Variscite 3. Beryllonite 4. Turquoise 5. Pyromorphite 6. Lazulite 7. Vanadinite |
|||
|
IV.2.7. SILICATES |
|||||
| IV.2.7.1. NESOSILICATES 1. Phenacite 2. Olivine (chrysolite) 3. Grenat 3.1. Almandin 3.2. Pyrope 3.3. Spessartite 3.4. Grossulaire vert 3.5. Grossulaire tsavorite 3.6. Andradite melanite 3.7. Andradite demantoide 3.8. Uvarovite 4. Zircon (brun, bleu) 5. Haut zircon 6. Chondrodite 7. Andalousite 8. Disthene 9. Sillimanite 10. Sphene 11. Staurotide 12. Topaz 13. Dumortierite 14. KornerupineIV.2.7.2. SOROSILICATES 1. Zoisite – Tanzanite vert - Tanzanite bleu - Thulite 2. Epidote 3. Vesuvianite 4. Danburite |
IV.2.7.3. CYCLOSILICATES 1. Benitoite 2. Beryl – Emeraude - Aigue-marine - Heliodore 3. Beryl vert 4. Cordierite 5. Axinite 6. Tourmaline – Rubellite - Olenite - Dravite - Indigolite - Verdelite - Shorlite 7. Eudialyte 8. Sugilite 9. Sogdianite |
IV.2.7.5. PHYLLOSILICATES 1. Muscovite 2. Phlogopite 3. Biotite 4. Lepidolite 5. Chlorite 6. Serpentine 7. Antigorite 8. Talc |
|||
| IV.2.7.4. INOSILICATES 1. Augite 2. Hedenbergite 3. Diopside vert 4. Cr-diopside 5. V-diopside 6. Spodumene – Kunzite - Hiddenite 7. Aegirine 8. Jadeite 9. Tremolite 10. Actinolite 11. Hornblende 12. Nephrite 13. Rhodonite 14. Charoite 15. Bustamite |
IV.2.7.6. TECTOSILICATES 1. Sanidine 2. Orthose 3. Microcline 4. Amazonite bleu 5. Amazonite vert 6. Albite 7. Oligoclase 8. Belomorite (Albite-Oligoclase) 9. Labrador 10. Bytownite 11. Moonstone 12. Adulaire 13. Scapolite 14. Glaucolite 15. Nepheline 16. Sodalite 17. Lazurite 18. Cancrinite |
||||
[/spoiler]
